
Interactive Visualization Platform
CPCS Infrastructure Analytics Unit (IAU)
Our extensive collection of prebuilt components and templates allow us to quickly design, customize, and iterate on highly-interactive data visualizations and dashboards
Visualization Templates
Ready to build your next interactive project? Check out these templates that we can quickly use as a starting point.
- CPCS/FCP interactive data story template
- IAU dashboard template
- IAU dashboard template (R version coming soon!)
- Interactive O-D / flow visualization components (coming soon!)
Guides and Galleries
View examples and read more detailed instructions and documentation on using components of the visualization platform
- Chart component sample gallery(coming soon!)
- Map component sample gallery(coming soon!)
- Animation and simulation sample gallery(coming soon!)
- Visual analytics toolkits (coming soon!)

Interactive Visualization Gallery
Projects, Prototypes, and Tools
A small collection of our interactive visualizations, dashboards, and data tools
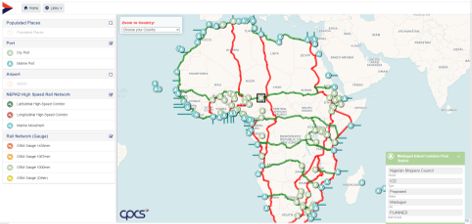
Africa Infrastructure Atlas

Freight Plan Public Engagement
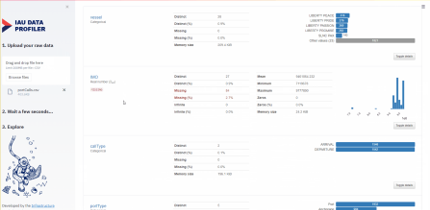
Automated Data Profiler
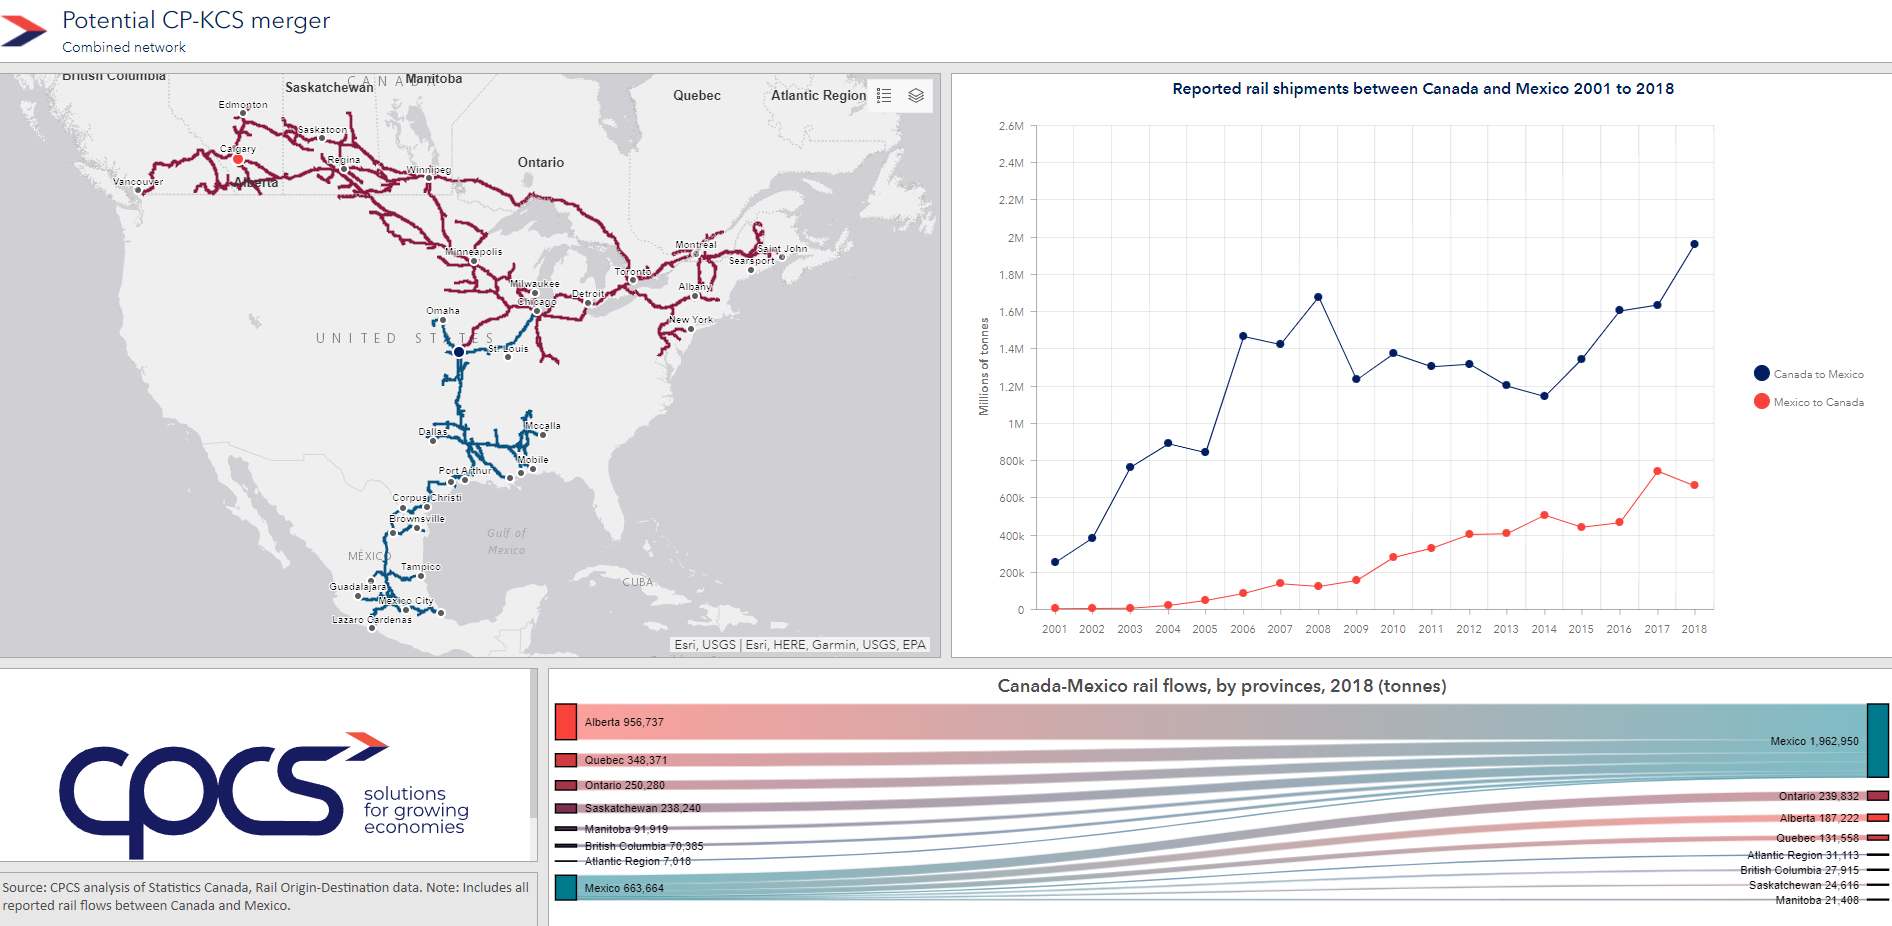
Canada-US-Mexico Rail-based Trade
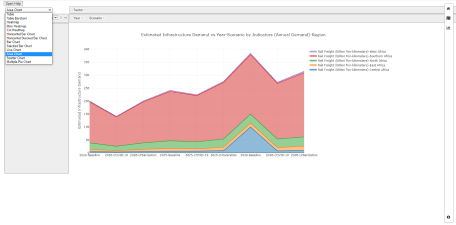
Infra Market and Demand Study

Interactive Story Map for Freight Visualization
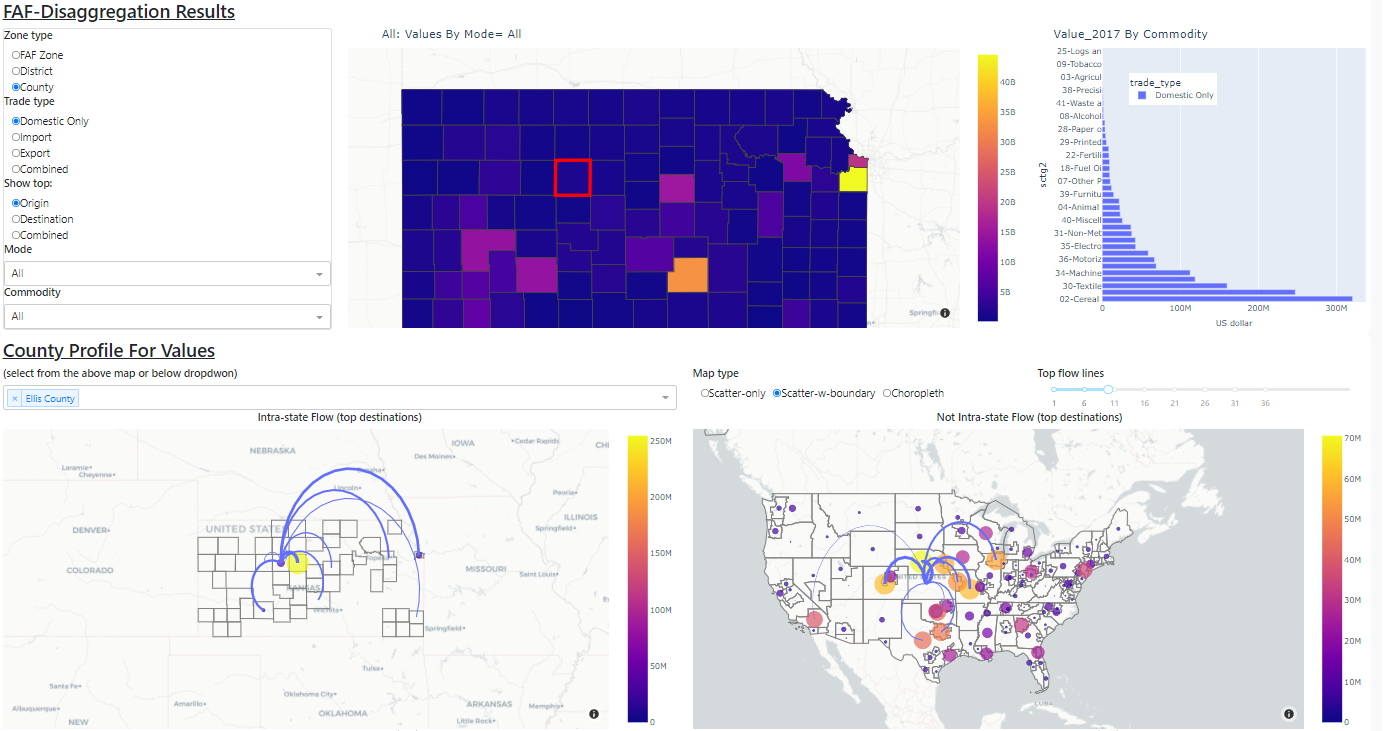
FAF Disaggregation Dashboard
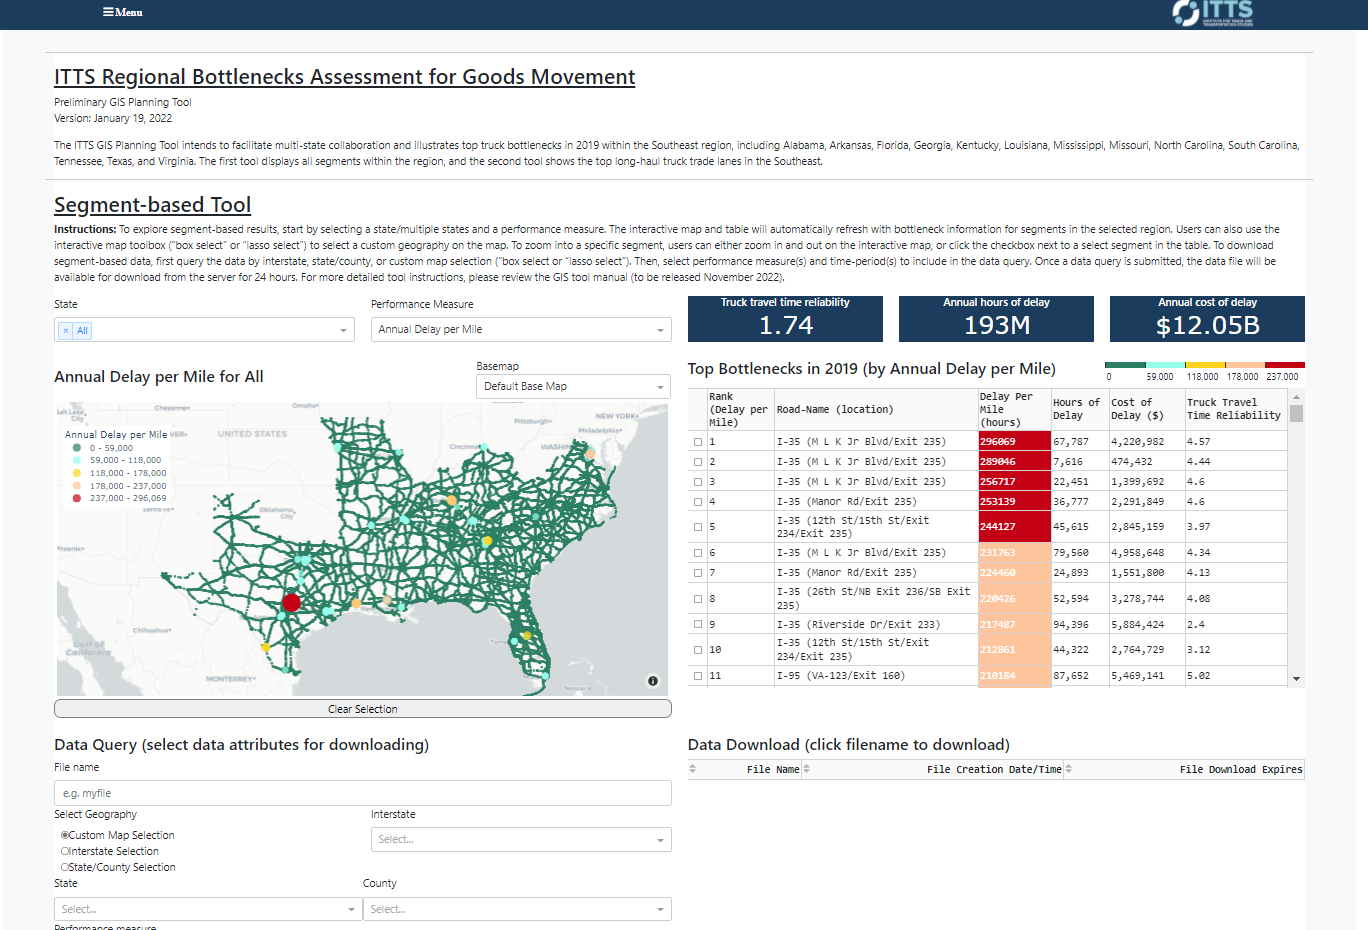
ITTS Interactive Tool
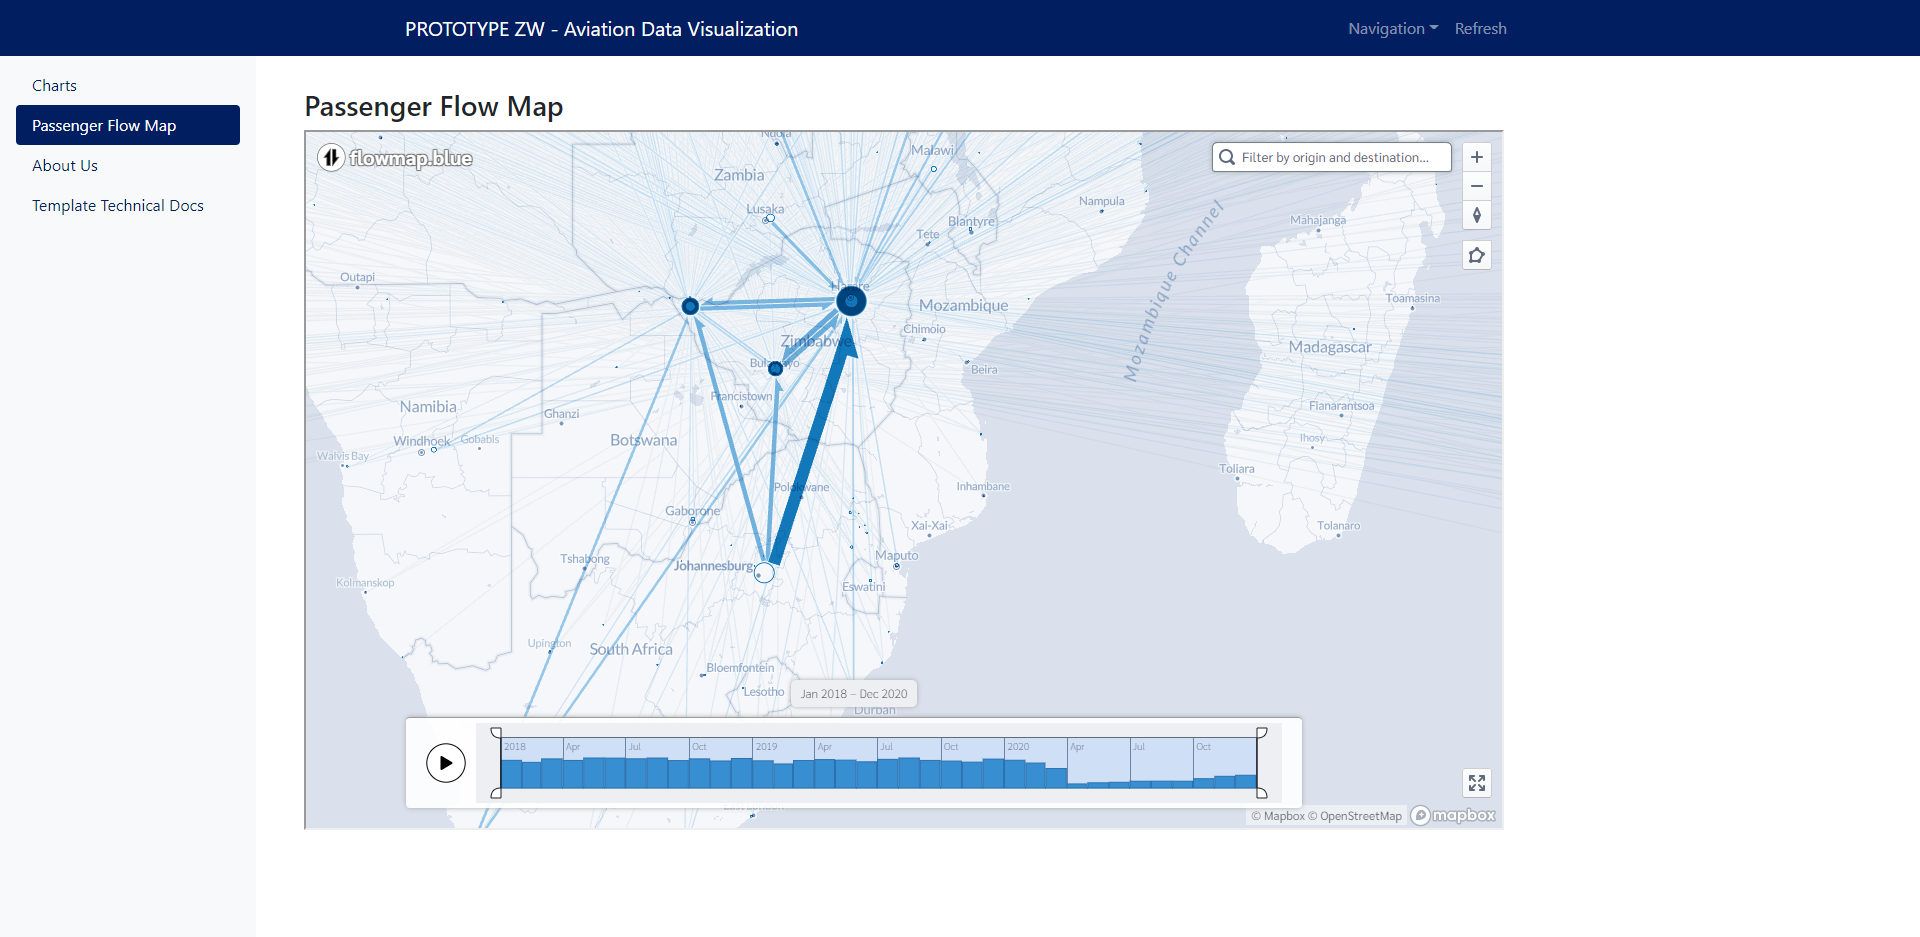
Aviation Dashboard

Comtrade
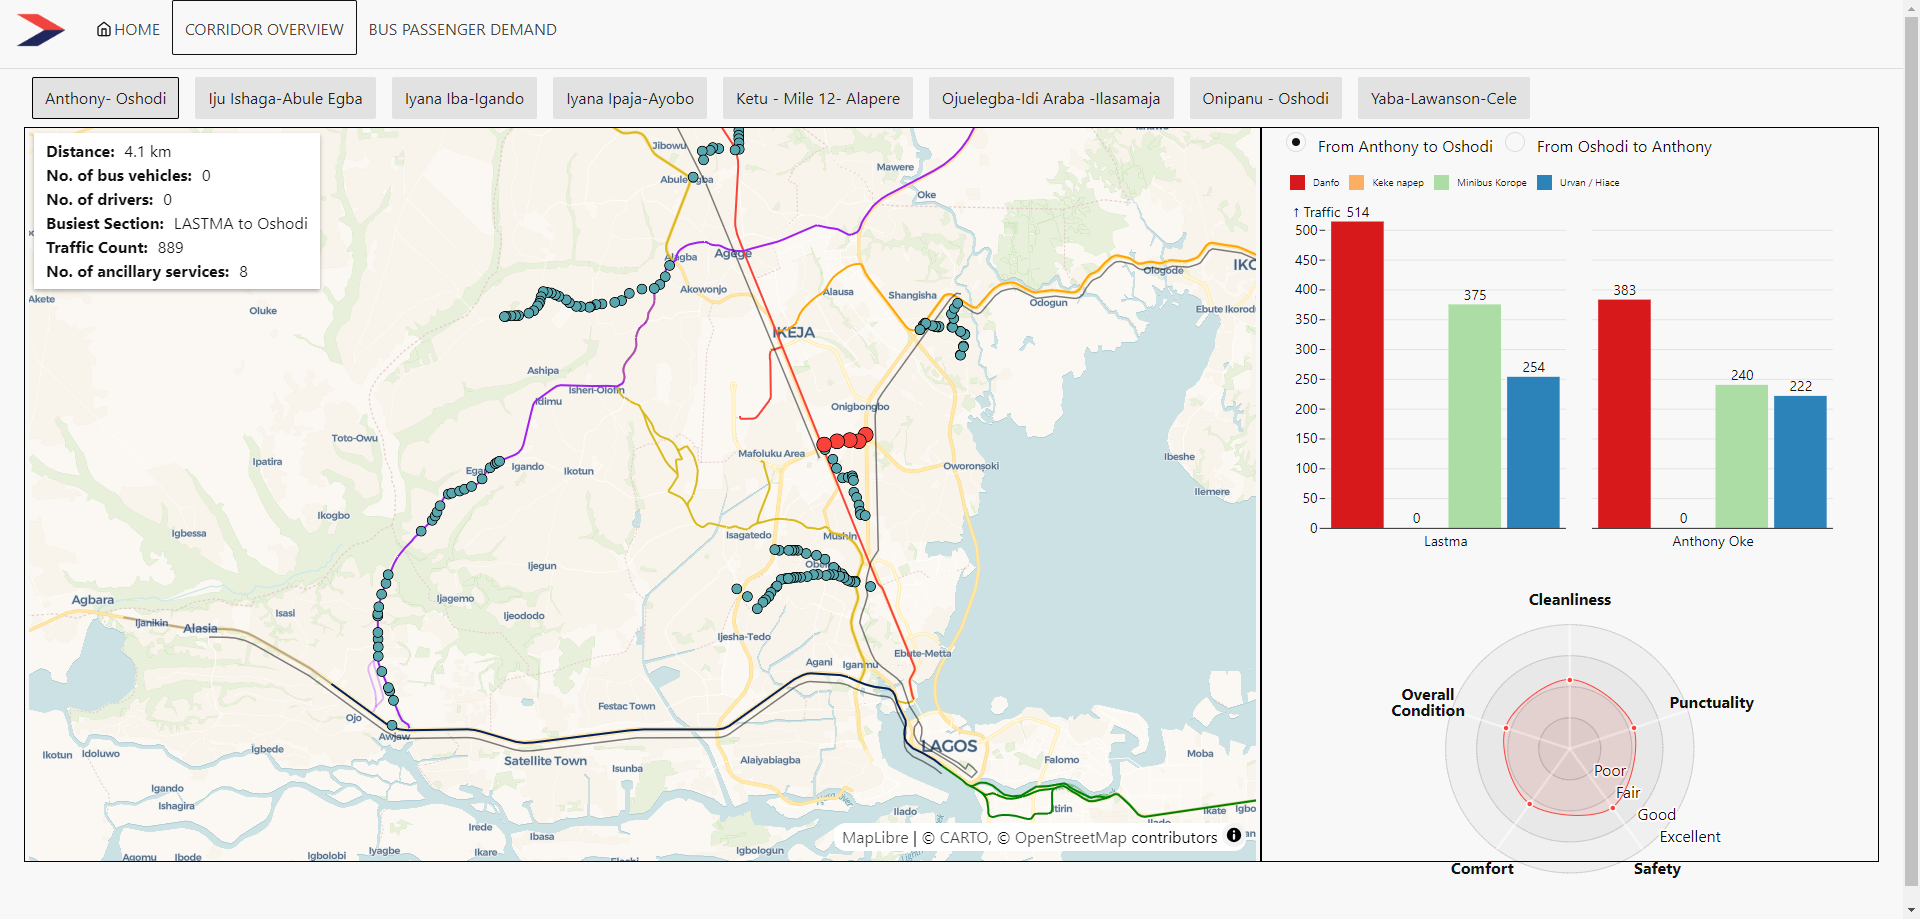
Bus Industry Transition Program (BITP)